Visualization Overview
msmu._plotting wraps Plotly to provide ready-made QC and exploratory plots for MuData objects. The module is structured around data preparation helpers and lightweight plot wrappers so you can compose figures with consistent defaults while still passing Plotly kwargs to tweak layout.
Common parameters and behaviors
mdata: requiredMuDatacontaining the modality to plot.modality: required forplot_id,plot_intensityandplot_missingness; elsewhere it defaults to the level the plot is normally read at (psmforplot_var,proteinforplot_pca,plot_umap,plot_correlationandplot_upset).groupby: observation column used to split traces/groups (e.g.,filename,condition). If omitted, falls back toobs_column.obs_column: observation column used for labeling/group resolution; all elements should be unique. If omitted or no column exists, creates__obs_idx__column from the index ofobscolorby: optional obs column for coloring; only applied whengroupbyequalsobs_column.ptype: plot style selector (hist,box,vln, etc.).layer: optional; plot a layer instead of.X(plot_id,plot_intensity,plot_missingness,plot_upset).template: optional Plotly template,"msmu"by default (plot_id,plot_intensity,plot_pca,plot_umap).**kwargs: forwarded togo.Figure.update_layoutfor per-plot overrides.
Per-plot optional arguments:
bins: histogram bin count forplot_intensityandplot_var.pcs: which principal components to draw inplot_pca, default(1, 2).key:.obsmkey holding the embedding, defaultX_pca/X_umap.subset,subset_column: restrictplot_upsetto one group of samples — it keeps the observations whosesubset_columnvalue in.obsequalssubset.
Example
Uszkoreit, J., Barkovits, K., Pacharra, S., Pfeiffer, K., Steinbach, S., Marcus, K., & Eisenacher, M. (2022). Dataset containing physiological amounts of spike-in proteins into murine C2C12 background as a ground truth quantitative LC-MS/MS reference. Data in Brief, 43, 108435.
mdata.obs
| set | sample_id | sample_name | condition | replicate |
|---|---|---|---|---|
| S1 | QExHF04026 | G1-1 | G1 | 1 |
| S1 | QExHF04028 | G2-1 | G2 | 1 |
| S1 | QExHF04030 | G3-1 | G3 | 1 |
| S1 | QExHF04032 | G4-1 | G4 | 1 |
| S1 | QExHF04034 | G5-1 | G5 | 1 |
| S1 | QExHF04036 | G1-2 | G1 | 2 |
| S1 | QExHF04038 | G2-2 | G2 | 2 |
| S1 | QExHF04040 | G3-2 | G3 | 2 |
| S1 | QExHF04042 | G4-2 | G4 | 2 |
| S1 | QExHF04044 | G5-2 | G5 | 2 |
| S1 | QExHF04046 | G1-3 | G1 | 3 |
| S1 | QExHF04048 | G2-3 | G2 | 3 |
| S1 | QExHF04050 | G3-3 | G3 | 3 |
| S1 | QExHF04052 | G4-3 | G4 | 3 |
| S1 | QExHF04054 | G5-3 | G5 | 3 |
plot_id
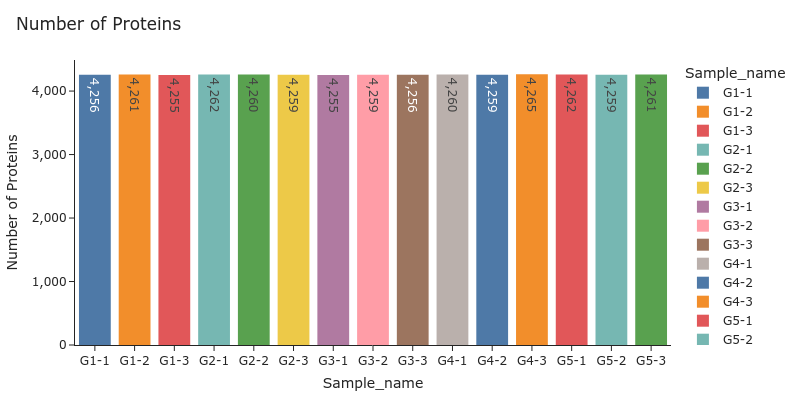
mm.pl.plot_id(mdata, "protein", groupby="sample_name")
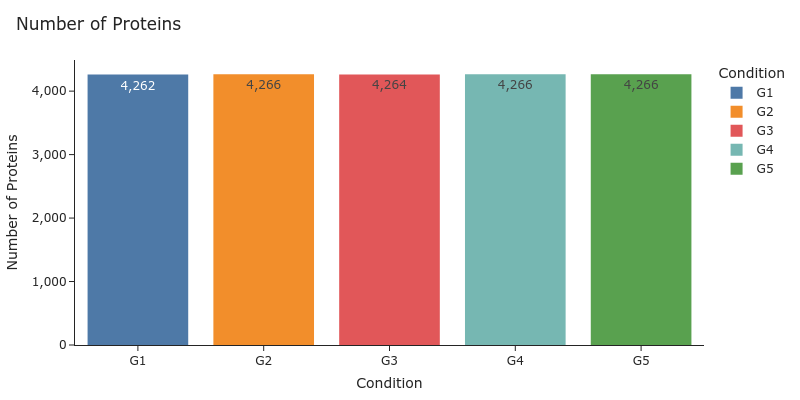
mm.pl.plot_id(mdata, "protein", groupby="condition")
plot_intensity
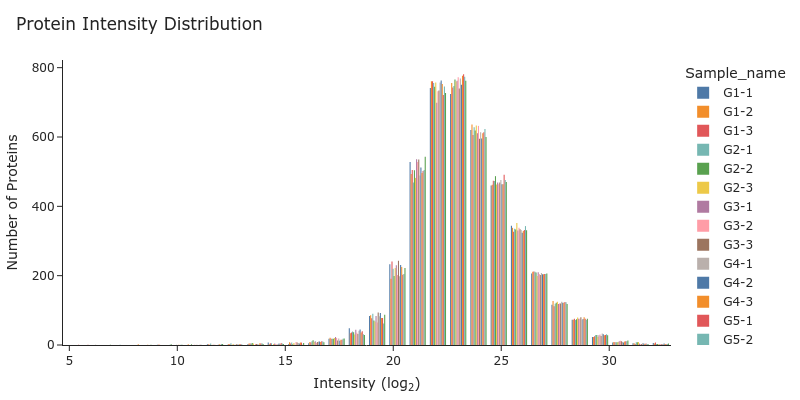
mm.pl.plot_intensity(mdata, "protein", groupby="sample_name", ptype="hist")
plot_missingness
mm.pl.plot_missingness(mdata, "protein")
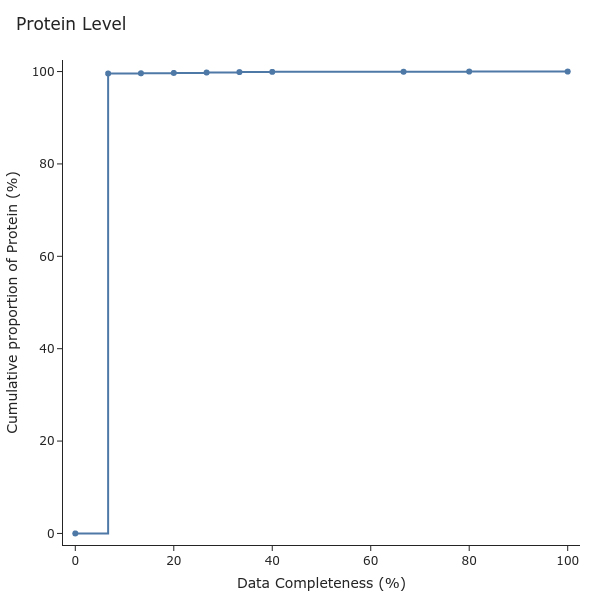
plot_var
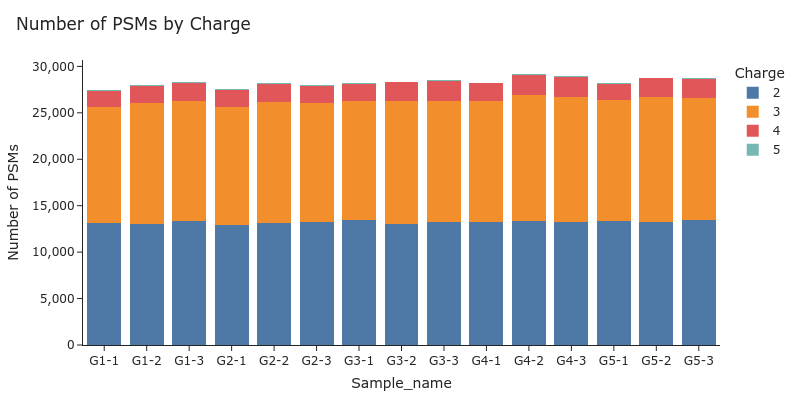
mm.pl.plot_var(mdata, "psm", groupby="sample_name", var_column="charge", ptype="stacked_bar")
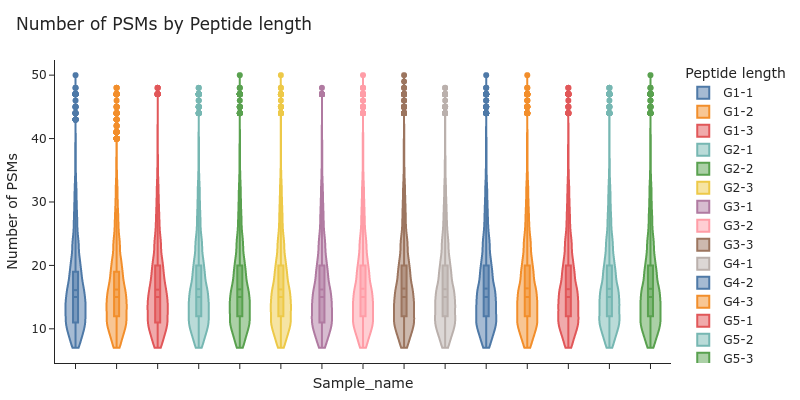
mm.pl.plot_var(mdata, "psm", groupby="sample_name", var_column="peptide_length", ptype="vln")
plot_pca & plot_umap
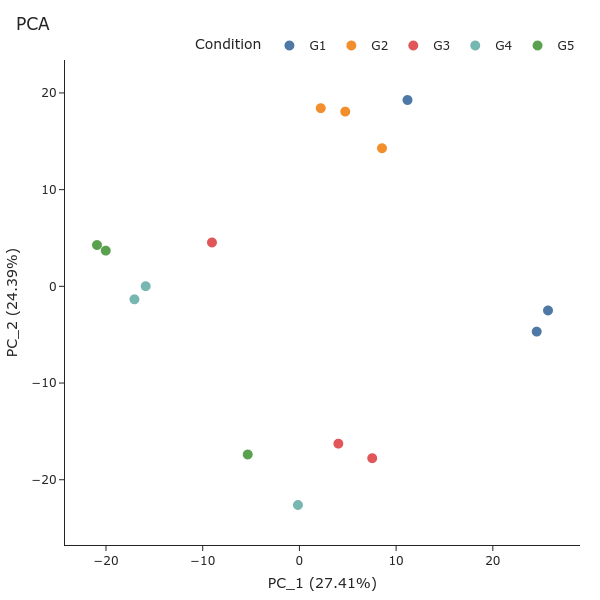
mm.pl.plot_pca(mdata, "protein", groupby="condition")
plot_pca(..., key="X_pca") expects:
- coordinates in mdata[modality].obsm[key]
- PCA variance metadata in mdata[modality].uns[key]["variance_ratio"]
plot_umap(..., key="X_umap") expects:
- coordinates in mdata[modality].obsm[key]
plot_correlation
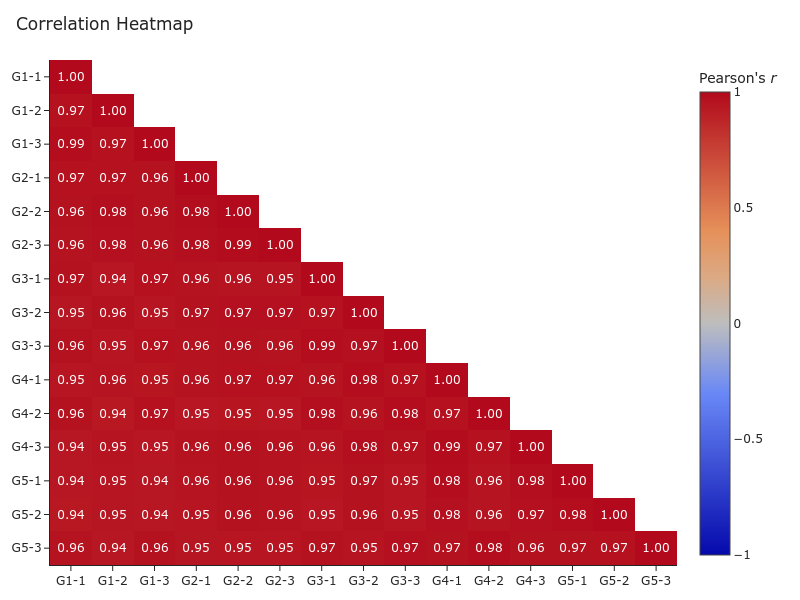
mm.pl.plot_correlation(mdata, "protein")
plot_upset
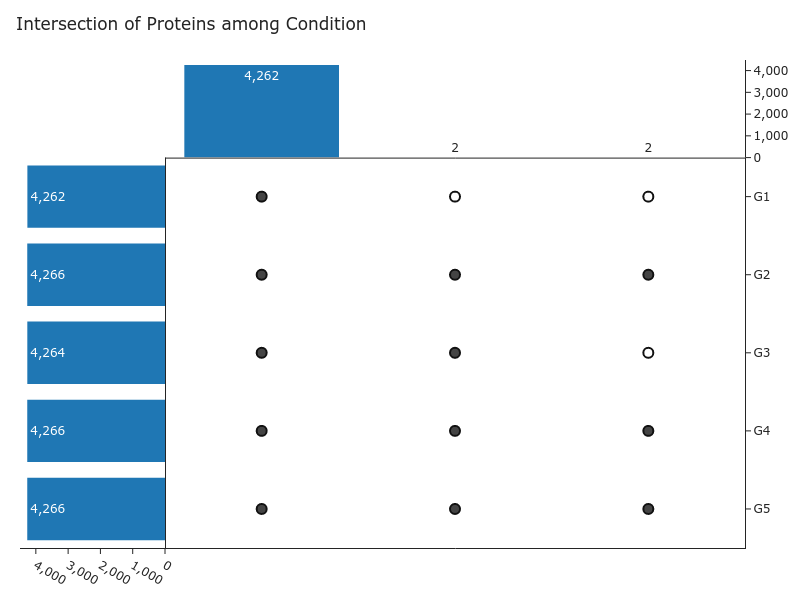
mm.pl.plot_upset(mdata, "protein", groupby="condition")